What Makes the Best Web Design Companies in Sri Lanka: Metrics That Matter (Conversion Rate, Load Speed, User Experience)
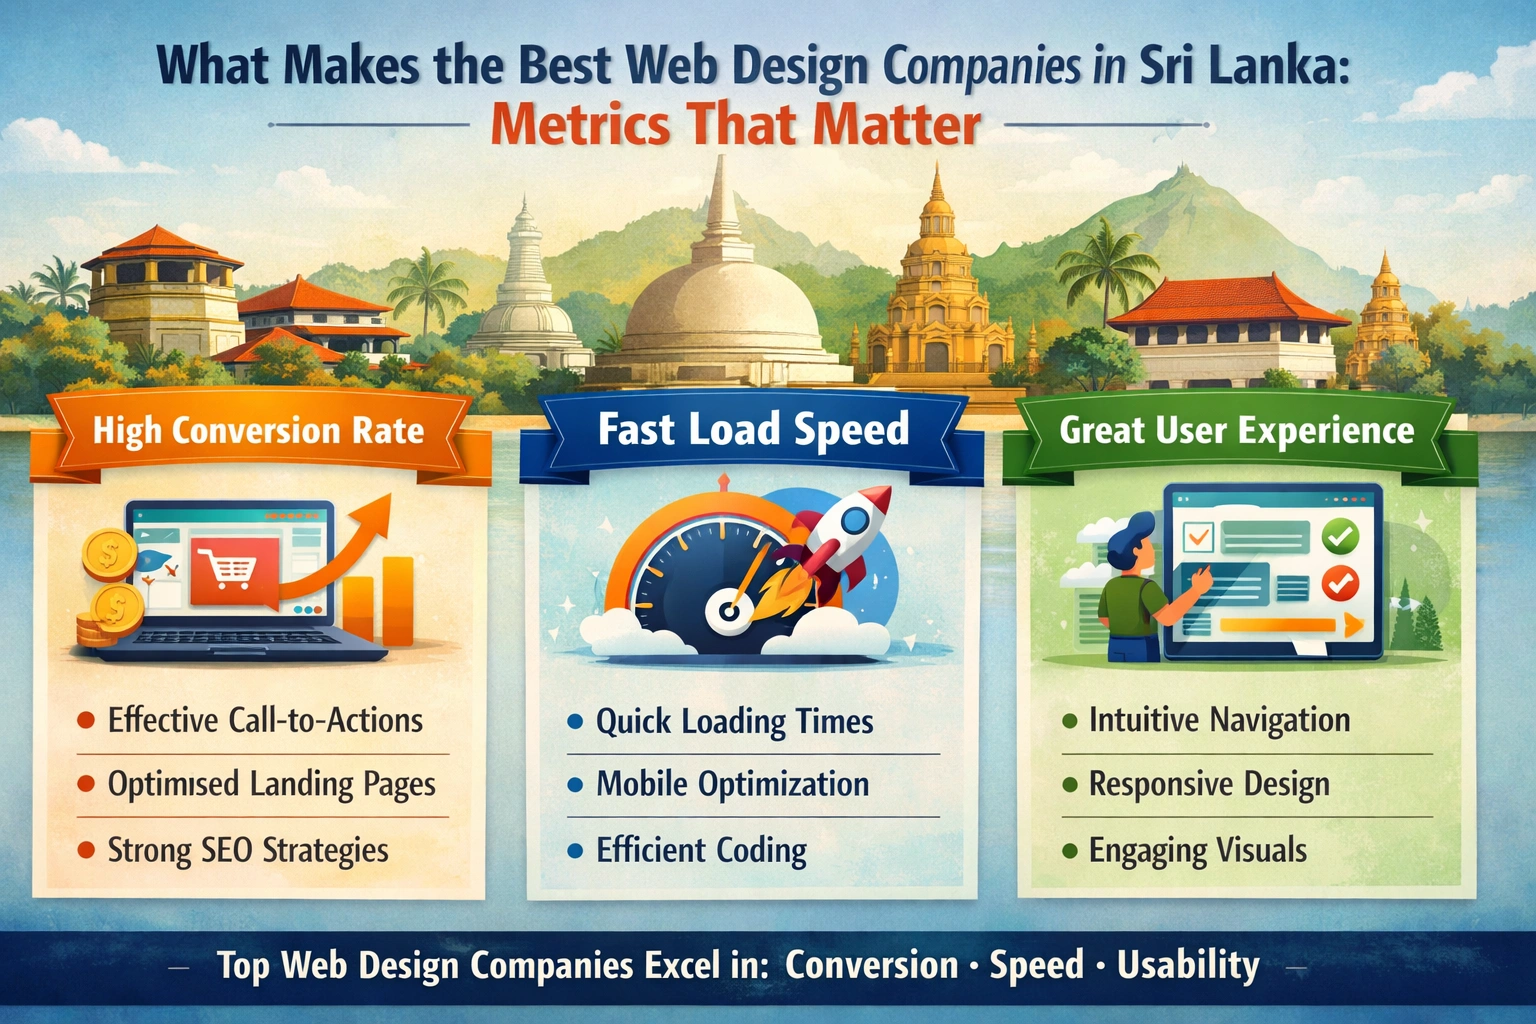
Subjective assessments of web design quality often lead businesses astray. A website might look stunning to your eyes yet fail to convert visitors into customers. Another site might seem plain but consistently outperform competitors in generating leads and sales. The best web design companies under...
Subjective assessments of web design quality often lead businesses astray. A website might look stunning to your eyes yet fail to convert visitors into customers. Another site might seem plain but consistently outperform competitors in generating leads and sales. The best web design companies understand that measurable performance indicators matter far more than aesthetic judgments alone. These metrics reveal whether design decisions actually serve business objectives or merely satisfy creative preferences.
Learning to evaluate design quality through objective measurements transforms how you assess potential partners. Rather than debating whether one portfolio piece looks better than another, you can compare concrete performance data that predicts real-world outcomes. A capable web design company in Sri Lanka should discuss these metrics fluently and demonstrate track records of achieving meaningful improvements for clients.
Conversion Rate: The Ultimate Business Metric
Conversion rate measures the percentage of website visitors who complete desired actions. Those actions vary by business type. E-commerce sites track purchases. Service businesses track contact form submissions or appointment bookings. Content publishers track newsletter signups or membership registrations. Whatever your primary objective, conversion rate quantifies how effectively your website accomplishes it.
Understanding conversion rate context matters as much as raw numbers. Industry averages provide baseline expectations, though these vary significantly across sectors. E-commerce conversion rates typically range from two to four percent globally, though top performers achieve much higher rates. Service business conversion rates depend heavily on traffic quality, with rates ranging from under one percent for cold traffic to ten percent or more for highly-qualified visitors. Evaluating conversion performance requires understanding what rates are achievable for your specific business model and traffic sources.
Conversion optimization involves far more than placing prominent buttons on pages. The best design companies approach conversion systematically, beginning with understanding user intent and removing obstacles between visitors and their goals. This includes analyzing user journeys to identify drop-off points, testing different page layouts and messaging approaches, and continuously refining based on performance data. Companies that discuss conversion optimization in these terms demonstrate sophisticated understanding of what drives business results.
Micro-Conversions and Engagement Metrics
Primary conversions represent only part of the engagement picture. Micro-conversions track smaller actions that indicate visitor interest and predict eventual macro-conversions. These include adding products to wishlists, downloading resources, watching videos, or expanding product details. Tracking micro-conversions reveals how effectively websites build interest that leads to ultimate purchases or inquiries.
Engagement metrics like time on site, pages per session, and scroll depth indicate whether visitors find content compelling enough to explore. Websites that capture attention and encourage exploration create more opportunities for conversion than those visitors quickly abandon. Design companies should demonstrate awareness of these engagement indicators and explain how design decisions influence them.
Page Load Speed: Technical Foundation for Success
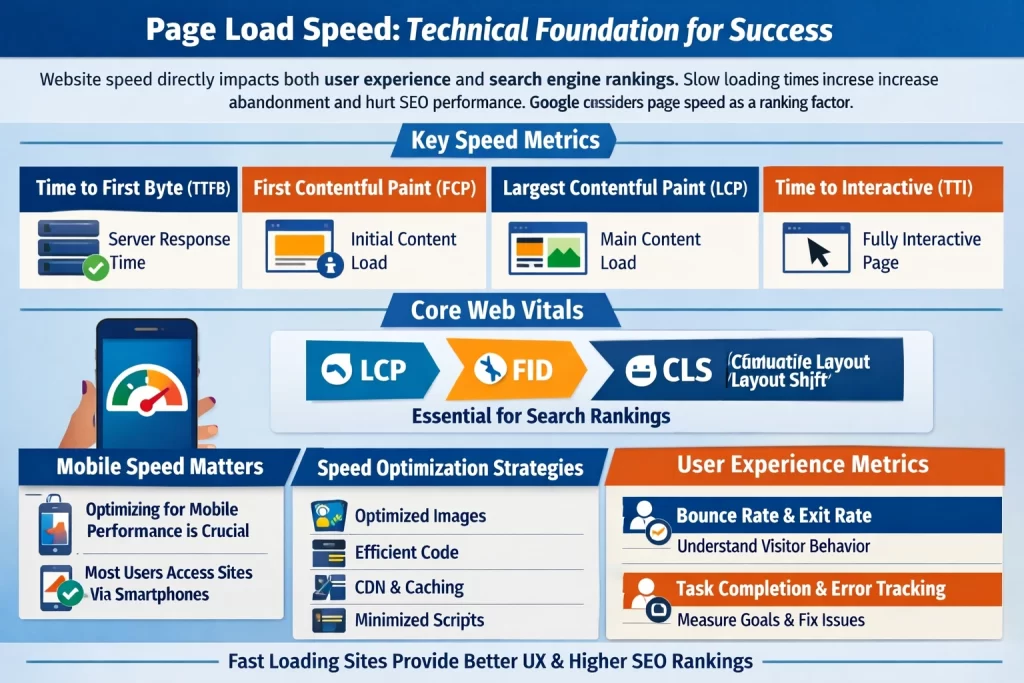
Website speed directly impacts both user experience and search engine rankings. Research consistently shows that slower loading times increase abandonment rates, with significant visitor loss occurring for each additional second of delay. Google explicitly includes page speed as a ranking factor, meaning slow sites suffer visibility penalties that compound direct user experience problems.
Measuring speed requires examining multiple metrics rather than relying on single numbers. Time to First Byte measures server response speed. First Contentful Paint indicates when visitors see initial content. Largest Contentful Paint marks when primary content becomes visible. Time to Interactive reveals when pages become functionally usable. Each metric captures different aspects of the loading experience, and optimizing for all of them produces genuinely fast-feeling websites.
Core Web Vitals, Google's user experience metrics, have become particularly important for search visibility. These measurements focus on loading performance, interactivity, and visual stability. Websites failing Core Web Vitals thresholds may struggle to achieve strong search rankings regardless of content quality. Design companies should demonstrate familiarity with these metrics and explain their optimization approaches.
Mobile Speed Considerations
Mobile speed deserves special attention given the dominance of smartphone traffic. Mobile devices typically connect through slower networks and process data with less powerful hardware than desktop computers. Websites optimized for desktop performance may still deliver poor mobile experiences. The best design companies test and optimize for mobile speed specifically, recognizing that most visitors likely access sites through smartphones.
Speed optimization involves both development practices and infrastructure choices. Clean, efficient code loads faster than bloated implementations. Properly optimized images reduce data transfer without compromising visual quality. Content delivery networks distribute assets geographically for faster access. Caching strategies reduce redundant processing. Quality web development in Sri Lanka incorporates these optimizations throughout the build process rather than attempting remediation after launch.
User Experience Metrics: Measuring Satisfaction
User experience encompasses how visitors feel while interacting with your website. While subjective satisfaction resists direct measurement, various metrics proxy for experience quality. Understanding these indicators helps evaluate whether design decisions serve users effectively.
Bounce rate measures the percentage of visitors who leave after viewing only one page. High bounce rates may indicate that landing pages fail to engage visitors or that traffic sources deliver poorly-matched audiences. However, bounce rate interpretation requires context. A single-page site naturally produces high bounce rates. Blog visitors who find answers and leave satisfied still register as bounces. Examining bounce rate alongside other metrics provides more meaningful insight than treating it in isolation.
Exit rate tracks where visitors leave during their journeys. Unlike bounce rate, exit rate applies to all pages regardless of whether they were entry points. Examining exit patterns reveals whether specific pages create problems that drive visitors away. High exit rates on checkout pages suggest cart abandonment issues. High exit rates on category pages may indicate navigation problems. These patterns guide optimization priorities.
Task Completion and Error Metrics
For goal-oriented websites, task completion rates measure whether visitors successfully accomplish their objectives. Form completion rates reveal whether inquiry processes create excessive friction. Checkout completion rates indicate e-commerce process effectiveness. Search success rates show whether site search helps visitors find desired content. Each metric points toward specific aspects of user experience requiring attention.
Error encounters frustrate users and signal technical or design problems. Tracking 404 errors from broken links, form submission failures, and payment processing problems reveals issues requiring correction. Websites accumulating errors degrade user experience progressively, making error monitoring essential for maintaining quality over time.
Search Visibility Metrics: Findability and Reach
Search engine performance determines how effectively your website attracts new visitors. While search algorithms remain partially opaque, various metrics indicate optimization effectiveness. Design companies should demonstrate understanding of these indicators and how design decisions influence them.
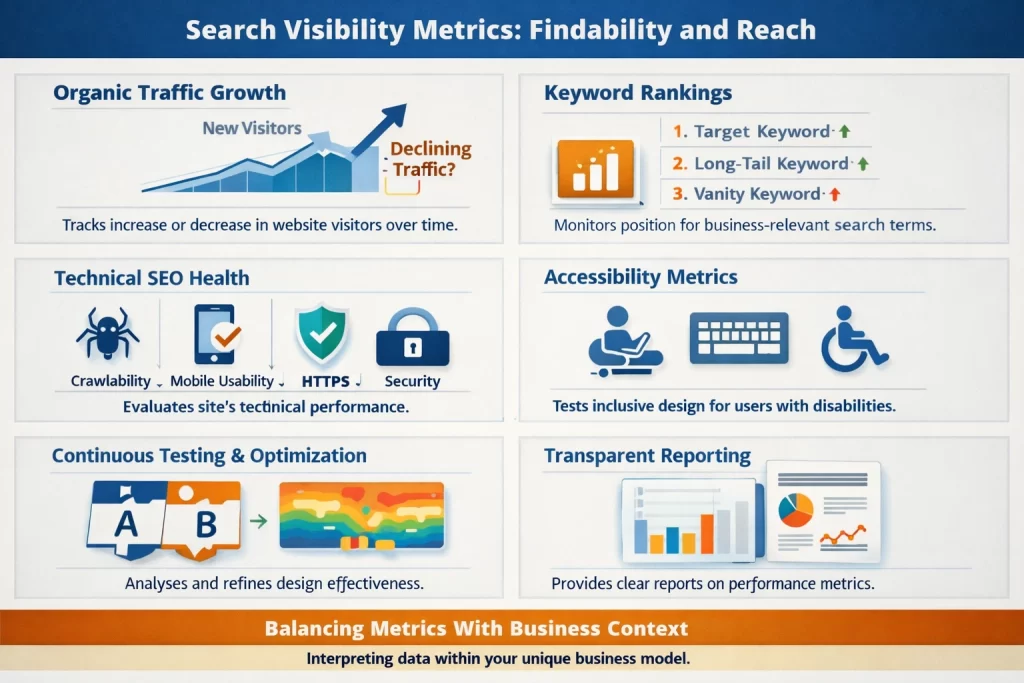
Organic traffic growth shows whether search visibility improves over time. Newly launched websites typically see gradual traffic increases as search engines index content and accumulate ranking signals. Established sites should maintain or grow organic traffic through ongoing optimization. Declining organic traffic may indicate technical problems, content staleness, or competitive pressure requiring attention.
Keyword rankings track visibility for specific search terms relevant to your business. Ranking improvements for target keywords indicate effective optimization. However, focusing exclusively on vanity keywords that lack commercial intent may produce traffic without business value. Quality search optimization targets terms that attract visitors likely to convert, not merely those generating highest volumes.
Technical SEO Health Indicators
Various technical factors influence search performance. Crawl efficiency determines how effectively search engines can index your content. Index coverage shows what percentage of your pages appear in search results. Mobile usability assessments indicate whether sites meet mobile-friendliness standards. Security status reflects whether proper HTTPS implementation protects visitors. Design companies should monitor and optimize these technical factors as part of comprehensive quality delivery.
Accessibility Metrics: Inclusive Design Quality
Accessibility metrics measure whether websites serve users with disabilities effectively. Beyond ethical considerations, accessibility affects legal compliance in some jurisdictions and influences search rankings. Websites that exclude users with visual, hearing, motor, or cognitive impairments miss potential customers while potentially exposing businesses to legal liability.
Automated accessibility testing identifies many common problems including missing image alt text, insufficient color contrast, improper heading structures, and keyboard navigation failures. These tests provide quantifiable scores indicating compliance with Web Content Accessibility Guidelines standards. Design companies should achieve strong automated test scores as minimum quality thresholds.
Manual accessibility testing remains necessary because automated tools cannot catch all problems. Screen reader testing verifies that assistive technology users can navigate effectively. Keyboard-only testing ensures mouse-free navigation works properly. User testing with people who have disabilities reveals real-world accessibility challenges that automated and simulated testing miss.
How the Best Companies Use Metrics
Understanding metrics matters less than applying them systematically to drive improvement. The best design companies establish baseline measurements before beginning projects, set specific performance targets, and track progress throughout development. This data-driven approach ensures design decisions serve measurable objectives rather than subjective preferences.
Continuous testing and optimization distinguishes top performers from those who deliver and disappear. A/B testing compares design variations to identify higher-performing options. Heat mapping reveals how visitors actually interact with pages versus how designers expected. User session recordings show real behavior patterns that inform refinement priorities. Companies that describe these practices demonstrate commitment to measurable results.
Transparent reporting keeps clients informed about performance reality. Regular reports covering key metrics build accountability and reveal whether investments produce expected returns. Companies that resist measurement or provide vague performance claims may be hiding results that fail to justify their fees.
Balancing Metrics With Business Context
Metrics require interpretation within business context rather than treating numbers as absolute truths. A boutique hotel website might convert at lower rates than budget accommodations while generating far more revenue per booking. A professional services firm might accept lower contact form volume in exchange for higher-quality inquiries that convert to substantial engagements. The best design partners understand your specific business model and interpret metrics accordingly.
Evaluating Design Companies Through Metrics
During partner evaluation, ask specific questions about metric tracking and optimization approaches. Request examples of performance improvements achieved for past clients, with specific numbers rather than vague claims of success. Examine whether portfolio presentations include performance data alongside visual examples.
Consider these evaluation questions:
- What metrics do you track for client websites and how often do you report them?
- Can you share specific performance improvement examples from past projects?
- How do you approach conversion optimization during design and development?
- What speed optimization techniques do you incorporate as standard practice?
- How do you test and validate user experience quality?
- What accessibility standards do you design to and how do you verify compliance?
Companies that answer these questions confidently with specific examples demonstrate metric literacy that predicts quality outcomes. Those who deflect toward subjective design discussions may prioritize aesthetics over business performance.
Setting Performance Expectations
Understanding metrics helps establish realistic project expectations. Discuss target metrics during project scoping to ensure alignment between your objectives and proposed approaches. Define how success will be measured and what performance levels constitute acceptable outcomes.
Build metric tracking into project deliverables. Analytics implementation should capture relevant data from launch day. Reporting mechanisms should provide ongoing visibility into performance. Optimization processes should establish how metrics will guide post-launch refinements.
Recognize that metric improvement often occurs gradually rather than immediately. New websites need time to accumulate search authority and traffic. Conversion optimization benefits from data accumulation that reveals patterns. Set both immediate targets for technical metrics like speed and longer-term targets for business outcomes like conversion rate and organic traffic growth.
The best web design in Sri Lanka combines creative excellence with measurable performance. Visual beauty matters, but not at the expense of business results. By understanding and demanding metric-driven quality, you position your project for outcomes that justify investment and drive genuine business growth. The metrics discussed here provide the vocabulary and framework for evaluating design quality objectively, ensuring you partner with companies that deliver results rather than merely attractive presentations.
Related Articles
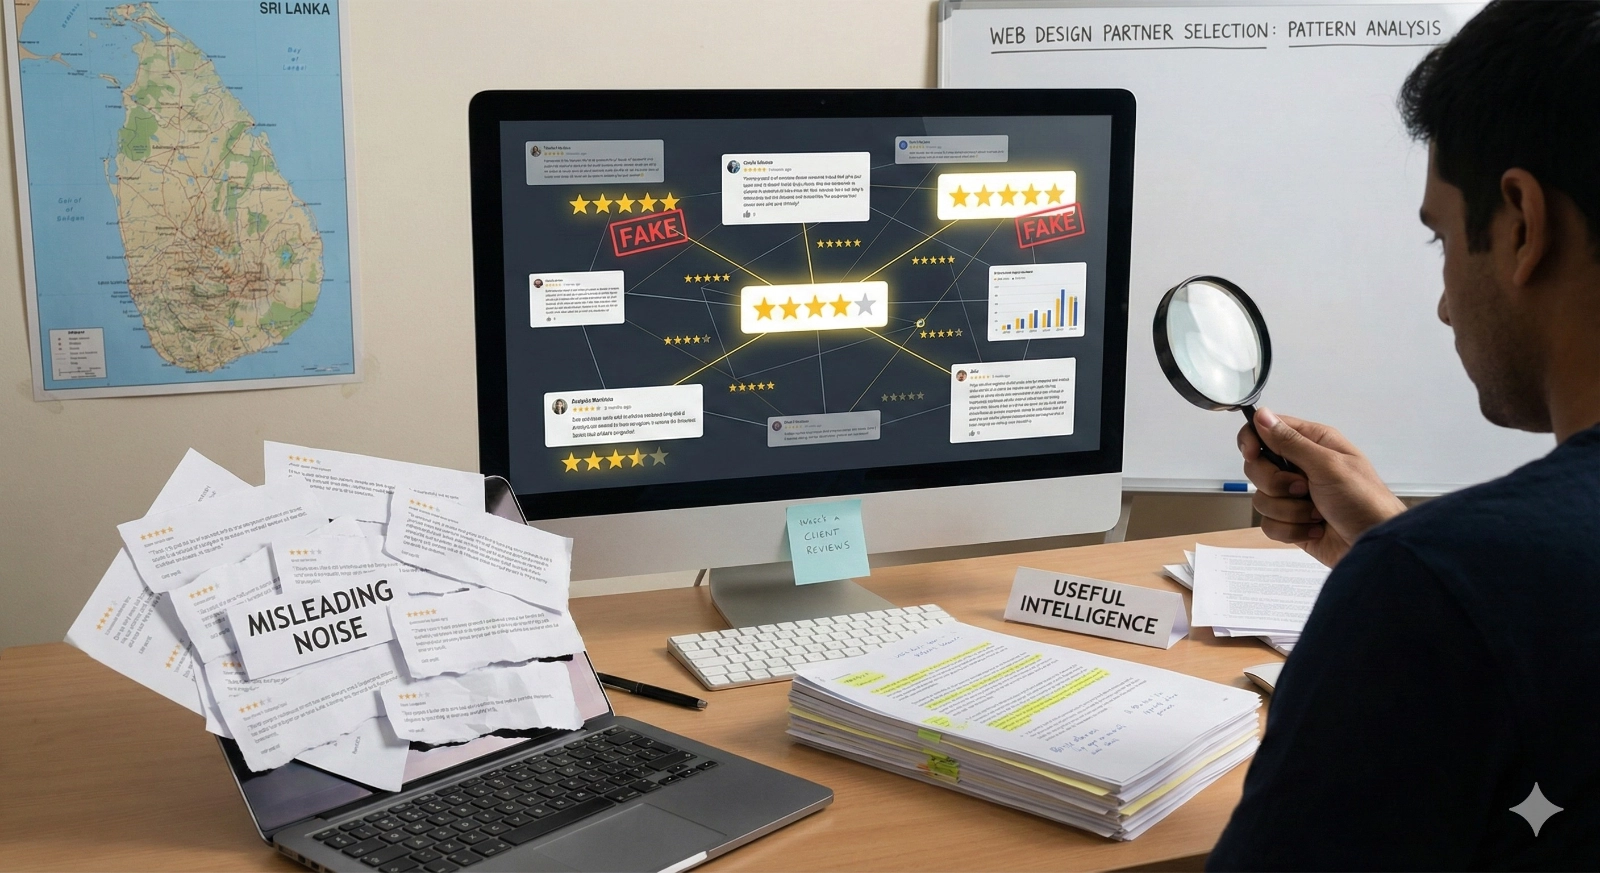
The Best Web Design Companies in Sri Lanka in 2026: Reviews, Ratings, and Real Client Feedback Analysis
Client reviews and ratings offer invaluable perspective when selecting a web design partner, revealing experiences that portfolios and capabilities presentations cannot convey. However, the review landscape has grown increasingly complex, with fake reviews, selective testimonials, and rating manipu...

Best Web Design Companies in Sri Lanka: Awards, Certifications, and What They Actually Mean for Your Project
Web design companies frequently display awards, certifications, and recognition badges throughout their websites and proposals. These credentials promise quality assurance and industry standing, but their actual significance varies enormously. Some certifications indicate genuine expertise validate...

Web Design Companies in Sri Lanka: Real Results from Transformation Projects Across Industries
Portfolio galleries and capability claims only tell part of the story when evaluating web design companies. The real measure of a design partner's value lies in the business outcomes they help clients achieve. Transformation projects demonstrate how professional web design converts struggling onlin...

Web Design Companies in Sri Lanka: What Services Should Your Partner Offer? (Design, Development, SEO, Maintenance)
Choosing a web design partner involves far more than comparing portfolios and price quotes. The services a company offers determine whether they can truly support your business growth or leave you scrambling to fill gaps with additional vendors. Many businesses in Sri Lanka discover too late that t...